Contents

Nginx Lua 扩展 --(Nginx 监控)

上周我从腾讯云买了一台服务器,开始将本站解析到腾讯云上,至此本站彻底支持了HTTP3访问。不过也需要对Nginx进行一定程度的封装。一个最佳的选择是使用 lua-nginx-module 来扩展Nginx的能力,比如我想对请求进行一些访问统计,将数据发送到 open-falcon 或者 Prometheus 上。

lua-nginx-module 是一个实现使用lua语言直接控制Nginx内HTTP请求的一个Nginx module。这个组合很强大,提供了动态语言的强悍性能和生产力。

安装

安装可以参考我的之前这篇文章 尝试 Nginx 上使用HTTP3,不过有个坑,直接从github上下载的 lua-nginx-module 执行 nginx 命令时会失败,需要切换分支至 v0.10.14

1
2
$ cd lua-nginx-module
$ git checkout v0.10.14

Nginx Lua 入门

Nginx Lua 首先是基于一个运行状态的Nginx,而Nginx的运行架构是 MASTER-WORKER 模式。 NGINX 启动后,会有一个 Master 进程和多个 Worker 进程。

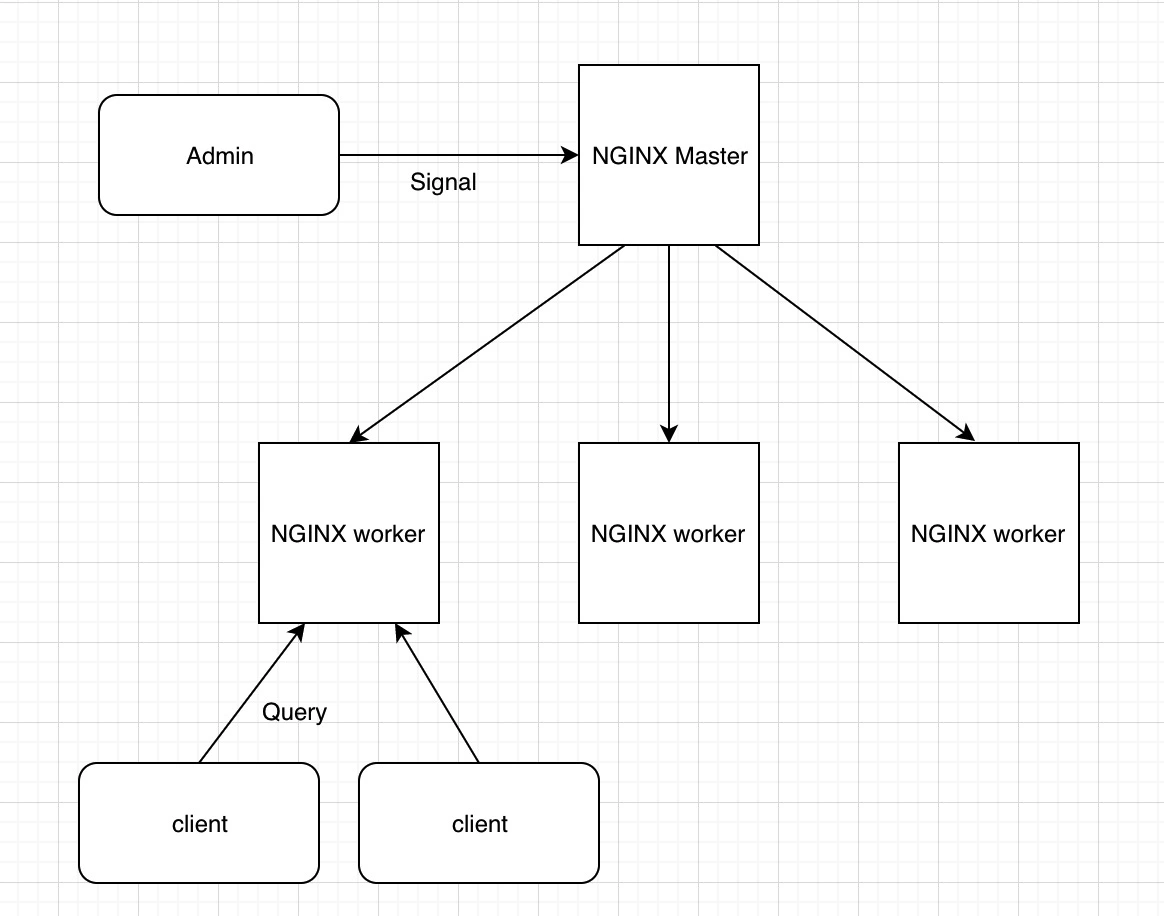
Master 进程:并不负责处理终端的请求。它是用来管理 Worker 进程的,包括接受管理员发送的信号量、监控 Worker 的运行状态。当 Worker 进程异常退出时,Master 进程会重新启动一个新的 Worker 进程。

Worker 进程:用来处理终端用户的请求。它是从 Master 进程 fork 出来的,彼此之间相互独立,互不影响。即使某个进程崩溃退出了,也不会影响其他 Worker 进程正常工作。

生效阶段

从 ngx_http_core_module.h 的源码中,可以看到Nginx有11个执行阶段。

 1
 2
 3
 4
 5
 6
 7
 8
 9
10
11
12
13
14
15
16
17
18
19
20
21

typedef enum {
    NGX_HTTP_POST_READ_PHASE = 0,

    NGX_HTTP_SERVER_REWRITE_PHASE,

    NGX_HTTP_FIND_CONFIG_PHASE,
    NGX_HTTP_REWRITE_PHASE,
    NGX_HTTP_POST_REWRITE_PHASE,

    NGX_HTTP_PREACCESS_PHASE,

    NGX_HTTP_ACCESS_PHASE,
    NGX_HTTP_POST_ACCESS_PHASE,

    NGX_HTTP_PRECONTENT_PHASE,

    NGX_HTTP_CONTENT_PHASE,

    NGX_HTTP_LOG_PHASE
} ngx_http_phases;

lua-nginx-module 有 11 个 *_by_lua指令,它们和 NGINX 阶段的关系如下图所示(图片来自 lua-nginx-module 文档):

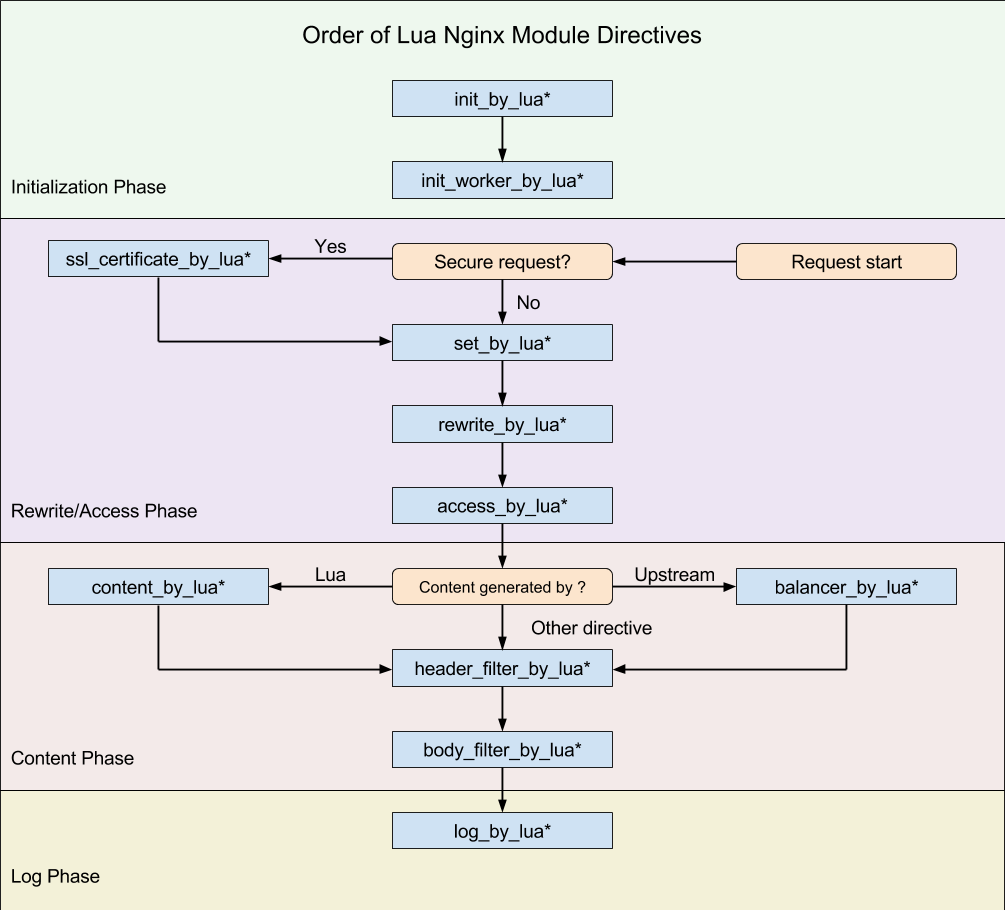
其中, init_by_lua 只会在 Master 进程被创建时执行,init_worker_by_lua 只会在每个 Worker 进程被创建时执行。其他的 *_by_lua 指令则是由终端请求触发,会被反复执行。

所以在 init_by_lua 阶段,我们可以预先加载 Lua 模块和公共的只读数据,这样可以利用操作系统的 COW(copy on write)特性,来节省一些内存。对于业务代码来说,其实大部分的操作都可以在 content_by_lua 里面完成,但我更推荐的做法,是根据不同的功能来进行拆分。

lua 简单语法

Lua 是一种轻量小巧的脚本语言,用标准C语言编写并以源代码形式开放, 其设计目的是为了嵌入应用程序中,从而为应用程序提供灵活的扩展和定制功能。lua的语法简单到直接参考一些网上教程就生产级别可用的代码。可以可参考 Lua 入门教程

详细的语法介绍介绍可以参考上述链接。这里不详述,需要注意的是 table 是 Lua 中唯一的数据结构,自然非常重要。另外lua有很多库,有 lua string 库table 库(常用的 table.concat 、table.sort 等少数几个函数)

局部变量 local lua 中的变量默认是全局变量,除非明确使用 local 声明。 lua 代码中可以看到大量的使用 local 关键字。 原因:

  • 避免命名冲突
  • 访问速度更快(原因是local变量是存放在lua的堆栈里面的是array操作,而全局变量是存放在_G中的table中,效率不及堆栈)

这里会只介绍一下 lua 的唯一数据结构 table 和 metatable 特性。

lua,只有 table 这一个数据结构,并没有区分开数组、哈希、集合等概念,而是揉在了一起。

1
2
3
4
5
6
local color = {first = "red", "blue", third = "green", "yellow"}
print(color["first"])                 --> output: red
print(color[1])                       --> output: blue
print(color["third"])                 --> output: green
print(color[2])                       --> output: yellow
print(color[3])                       --> output: nil

这个例子中, color 这个 table 包含了数组和哈希,并且可以互不干扰地进行访问。比如,你可以用 ipairs 函数,只遍历数组部分的内容:

1
2
3
4
5
6

local color = {first = "red", "blue", third = "green", "yellow"}
for k, v in ipairs(color) do
     print(k)
end

常见的table有 getnremoveconcatinsert 等方法,都是看名字就知道其用途的方法。

元表(metatable)是 Lua 中独有的概念,在实际项目中的使用非常广泛。不夸张地说,在几乎所有的 lua-resty-* 库中,都能看到它的身影。

元表的表现行为类似于操作符重载,比如我们可以重载 __add,来计算两个 Lua 数组的并集;或者重载 __tostring,来定义转换为字符串的函数

metatable 有2个函数

  • 第一个是setmetatable(table, metatable), 用于为一个 table 设置元表;
  • 第二个是getmetatable(table),用于获取 table 的元表。

举个例子,

 1
 2
 3
 4
 5
 6
 7
 8
 9
10
11
12
local version = {
  major = 1,
  minor = 1,
  patch = 1
  }
version = setmetatable(version, {
    __tostring = function(t)
      return string.format("%d.%d.%d", t.major, t.minor, t.patch)
    end
})
print(tostring(version))

首先定义了一个 名为 version的 table ,这段代码的目的,是想把 version 中的版本号打印出来。但是,我们并不能直接打印 version,直接打印的话,只会输出这个 table 的地址。

1
print(tostring(version))   --output: 1.1.1

除了__tostring 之外,还有一个常用的就是 __index 。我们在 table 中查找一个元素时,首先会直接从 table 中查询,如果没有找到,就继续到元表的 __index 中查询。

 1
 2
 3
 4
 5
 6
 7
 8
 9
10
11
12
13
14
15
16
17

local version = {
  major = 1,
  minor = 1
  }
version = setmetatable(version, {
     __index = function(t, key)
         if key == "patch" then
             return 2
         end
     end,
     __tostring = function(t)
      return string.format("%d.%d.%d", t.major, t.minor, t.patch)
    end
})
print(tostring(version))

这样的话,t.patch 其实获取不到值,那么就会走到 __index 这个函数中,结果就会打印出 1.1.2。

另一个元方法则是__call。它类似于仿函数,可以让 table 被调用。

 1
 2
 3
 4
 5
 6
 7
 8
 9
10
11
12
13
14
local version = {
  major = 1,
  minor = 1,
  patch = 1
  }

local function print_version(t)
     print(string.format("%d.%d.%d", t.major, t.minor, t.patch))
end

version = setmetatable(version,
     {__call = print_version})

version()

常见的元表就如上图所示,完整的元表可以参考 文档

以下是 lua-resty-mysql 的源码,可以看看官方的一些lua代码的写法, 里面就用了元表来模拟类和方法。

1
2
3
4
$ resty -e 'local mysql = require "resty.mysql" -- 先引用 lua-resty 库
local db, err = mysql:new() -- 新建一个类的实例
db:set_timeout(1000) -- 调用类的方法'

注意: 在这里冒号和点号都是可以的,db:set_timeout(1000) 和 db.set_timeout(db, 1000) 是完全等价的。冒号是 Lua 中的一个语法糖,可以省略掉函数的第一个参数 self。

 1
 2
 3
 4
 5
 6
 7
 8
 9
10
11
12
13
14
15
16
17
18
19
20
21
22

local _M = { _VERSION = '0.21' } -- 使用 table 模拟类
local mt = { __index = _M } -- mt 即 metatable 的缩写,__index 指向类自身

-- 类的构造函数
function _M.new(self) 
     local sock, err = tcp()
     if not sock then
         return nil, err
     end
     return setmetatable({ sock = sock }, mt) -- 使用 table 和 metatable 模拟类的实例
end
 
-- 类的成员函数
 function _M.set_timeout(self, timeout) -- 使用 self 参数,获取要操作的类的实例
     local sock = self.sock
     if not sock then
        return nil, "not initialized"
     end

    return sock:settimeout(timeout)
end

_M 这个 table 模拟了一个类,初始化时,它只有 _VERSION 这一个成员变量,并在随后定义了 _M.set_timeout 等成员函数。在 _M.new(self) 这个构造函数中,我们返回了一个 table,这个 table 的元表就是 mt,而 mt 的 __index 元方法指向了 _M,这样,返回的这个 table 就模拟了类 _M 的实例。

最小实现

我们可以先构建一个最间版本的 Nginx 运行状态,这需要3步。1. 创建工作目录。2. 编写简版nginx.conf。3. 启动nginx

  • 创建工作目录
1
2
3
4
mkdir test
cd test
mkdir logs/ conf/

 1
 2
 3
 4
 5
 6
 7
 8
 9
10
11
12
13
14
15

events {
    worker_connections 1024;
}

http {
    server {
        listen 8080;
        location / {
            content_by_lua '
                ngx.say("hello, world")
            ';
        }
    }
}
  • 启动nginx
1
nginx -p test -c conf/nginx.conf

上面是一个最简单的lua代码,在 location / 中有一个 content_by_lua 可以在后面写lua代码,也可以 content_by_lua_file lua/hello.lua; 的形式

更多的例子可以参考 这里

Nginx Lua API

nginx_lua_module 的 API 主要分为下面几个大类:处理请求和响应SSL 相关shared dictcosocket处理四层流量process 和 worker获取 NGINX 变量和配置字符串时间编解码等通用功能。

完整可以API可以参考官方文档

Nginx 中的请求变量可以在lua中获取到。

  • $scheme 这个内置变量,在 NGINX 中代表协议的名字,是 “http” 或者 “https”;而在 OpenResty 中,你可以通过 ngx.var.scheme 来返回同样的值。
  • $request_method 代表的是请求的方法,“GET”、“POST” 等;而在 OpenResty 中,你可以通过 ngx.var.request_method 来返回同样的值。

至于完整的 NGINX 内置变量列表,可以访问 NGINX 的官方文档来获取:

http://nginx.org/en/docs/http/ngx_http_core_module.html#variables

worker 件通信

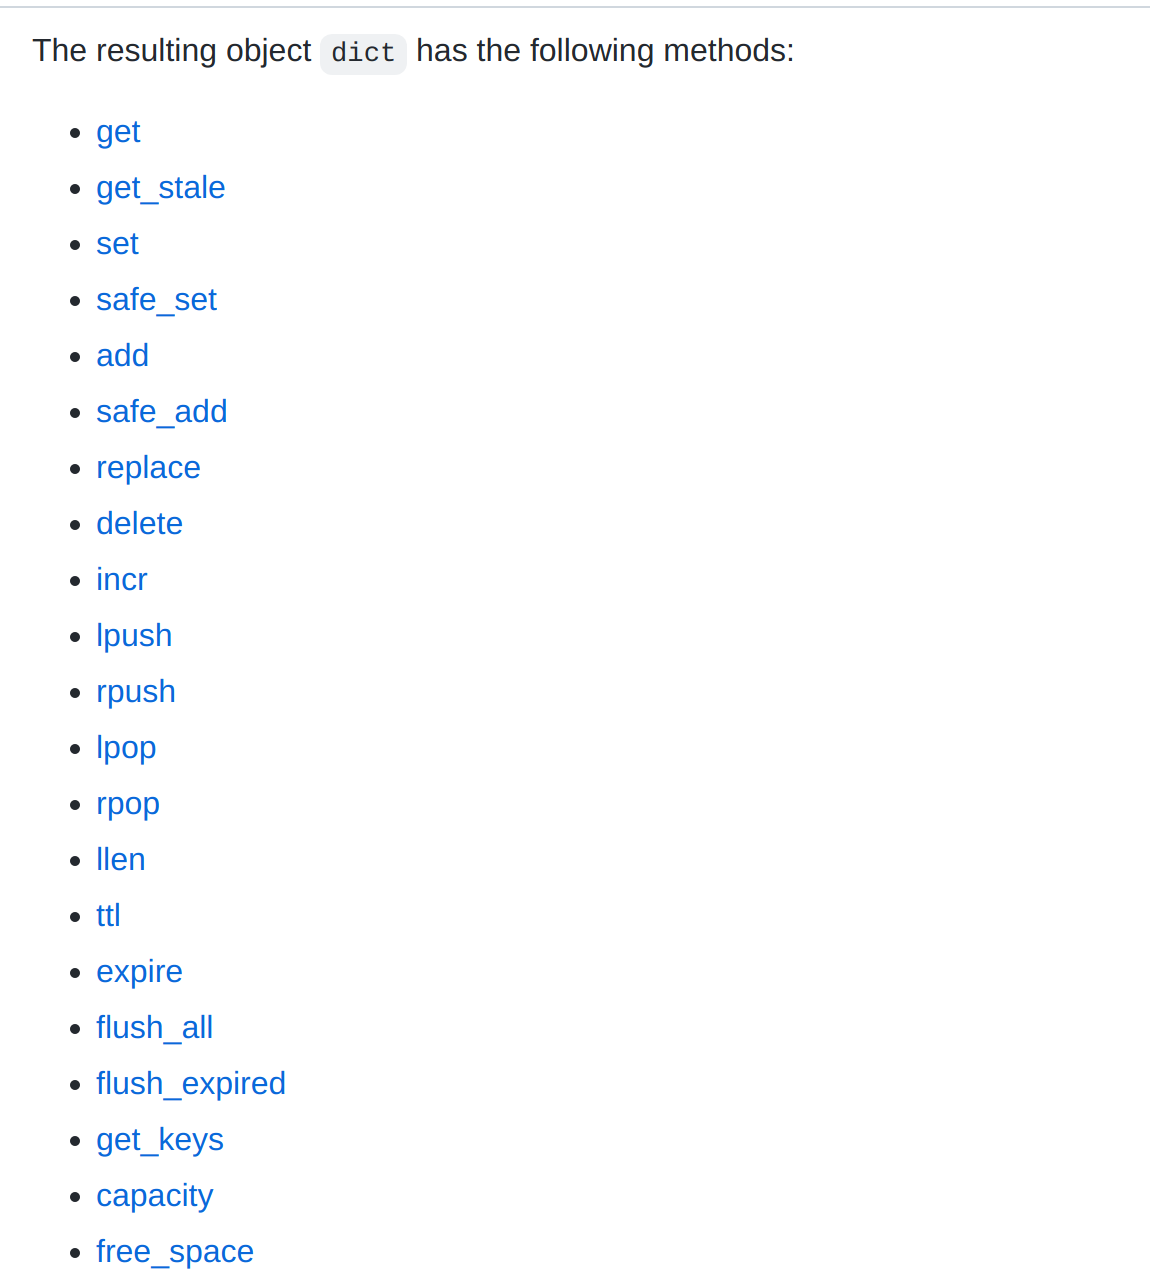
共享内存字典 shared dict,是你在 Nginx lua 编程中最为重要的数据结构。它不仅支持数据的存放和读取,还支持原子计数和队列操作。基于 shared dict,你可以实现多个 worker 之间的缓存和通信,以及限流限速、流量统计等功能。你可以把 shared dict 当作简单的 Redis 来使用,只不过 shared dict 中的数据不能持久化,所以你存放在其中的数据,一定要考虑到丢失的情况。

数据共享的几种方式

**第一种是 Nginx 中的变量。**它可以在 Nginx C 模块之间共享数据,自然的,也可以在 C 模块和 OpenResty 提供的 lua-nginx-module 之间共享数据

1
2
3
4
5
6
7
location /foo {
     set $my_var ''; # this line is required to create $my_var at config time
     content_by_lua_block {
         ngx.var.my_var = 123;
         ...
     }
 }

**第二种是ngx.ctx,可以在同一个请求的不同阶段之间共享数据。**它其实就是一个普通的 Lua 的 table,所以速度很快,还可以存储各种 Lua 的对象。它的生命周期是请求级别的,当一个请求结束的时候,ngx.ctx 也会跟着被销毁掉。

 1
 2
 3
 4
 5
 6
 7
 8
 9
10
11
12
13
14

location /test {
     rewrite_by_lua_block {
         ngx.ctx.host = ngx.var.host
     }
     access_by_lua_block {
        if (ngx.ctx.host == 'openresty.org') then
            ngx.ctx.host = 'test.com'
        end
     }
     content_by_lua_block {
         ngx.say(ngx.ctx.host)
     }
 }

d第三种用 shared dict 来共享数据,这些数据可以在多个 worker 之间共享。

这种方法是基于红黑树实现的,性能很好,但也有自己的局限性——你必须事先在 Nginx 的配置文件中,声明共享内存的大小,并且这不能在运行期更改:

1
lua_shared_dict dogs 10m;

shared dict 同样只能缓存字符串类型的数据,不支持复杂的 Lua 数据类型。这也就意味着,当我需要存放 table 等复杂的数据类型时,我将不得不使用 json 或者其他的方法,来序列化和反序列化,这自然会带来不小的性能损耗。

shared dict 同样支持多种api调用,如 setgetincrreplace等,具体可以参考官方文档

prometheus 监控 Nginx

Prometheus是一个开放性的监控解决方案,用户可以非常方便的安装和使用Prometheus并且能够非常方便的对其进行扩展。

安装 prometheus

  • 安装 prometheus server

Prometheus基于Golang编写,编译后的软件包,不依赖于任何的第三方依赖。用户只需要下载对应平台的二进制包,解压并且添加基本的配置即可正常启动Prometheus Server。

安装的完整教程可以参考:https://www.prometheus.wang/quickstart/install-prometheus-server.html

Promtheus作为一个时间序列数据库,其采集的数据会以文件的形似存储在本地中,默认的存储路径为data/,因此我们需要先手动创建该目录:

1
mkdir data

用户也可以通过参数--storage.tsdb.path="data/"修改本地数据存储的路径。

启动prometheus服务,其会默认加载当前路径下的prometheus.yaml文件:

1
2
3
4
5
6
7
8
./prometheus 
level=info ts=2018-10-23T14:55:14.499484Z caller=main.go:554 msg="Starting TSDB ..."
level=info ts=2018-10-23T14:55:14.499531Z caller=web.go:397 component=web msg="Start listening for connections" address=0.0.0.0:9090
level=info ts=2018-10-23T14:55:14.507999Z caller=main.go:564 msg="TSDB started"
level=info ts=2018-10-23T14:55:14.508068Z caller=main.go:624 msg="Loading configuration file" filename=prometheus.yml
level=info ts=2018-10-23T14:55:14.509509Z caller=main.go:650 msg="Completed loading of configuration file" filename=prometheus.yml
level=info ts=2018-10-23T14:55:14.509537Z caller=main.go:523 msg="Server is ready to receive web requests."

启动完成后,可以通过http://localhost:9090访问Prometheus的UI界面:

  • 安装 Node exporter

在Prometheus的架构设计中,Prometheus Server并不直接服务监控特定的目标,其主要任务负责数据的收集,存储并且对外提供数据查询支持。因此为了能够能够监控到某些东西,如主机的CPU使用率,我们需要使用到Exporter。Prometheus周期性的从Exporter暴露的HTTP服务地址(通常是/metrics)拉取监控样本数据。

这里为了能够采集到主机的运行指标如CPU, 内存,磁盘等信息。我们可以使用 Node Exporter

另外可以参考 文章 将prometheus 设置为systemd监管。

从日志上可以看出 node_exporter 监听在 9100 端口上,默认的 metrics 接口通过 /metrics 端点暴露,我们可以通过访问 http://localhost:9100/metrics 来获取监控指标数据,该 metrics 接口数据就是一个标准的 Prometheus 监控指标格式,我们只需要将该端点配置到 Prometheus 中即可抓取该指标数据。

监控

Prometheus 四大度量指标

  1. Counter (计数器)
  • 描述:Counter 类型代表一个累积的指标数据,其单调递增,只增不减。在应用场景中,像是请求次数、错误数量等等,就非常适合用 Counter 来做指标类型,另外 Counter 类型,只有在被采集端重新启动时才会归零。

  • 常用方法:

方法名作用
Inc()将计数器递增1
Add(float64)将给定添加计数器中,小于0报错
  1. Gauge (仪表盘)
  • 描述: Gauge 类型代表一个可以任意变化的指标数据,其可增可减。在应用场景中,像是 Go 应用程序运行时的 Goroutine 的数量就可以用该类型来表示,在系统中统计 **CPU、Memory **等等时很常见,而在业务场景中,业务队列的数量 也可以用 Gauge 来统计,实时观察队列数量,及时发现堆积情况,因为其是浮动的数值,并非固定的,侧重于反馈当前的情况

  • 常用方法:

方法名作用
Set(float64)将仪表设置为任意值
Inc()将仪表增加 1
Dec()将仪表减少 1
Add(float64)将给定值添加到仪表,该值如果为负数,那么将导致仪表值减少
Sub(float64)从仪表中减去给定值,该值如果为负数,那么将导致仪表值增加
SetToCurrentTime()将仪表设置为当前Unix时间(以秒为单位)
  1. Histogram(累积直方图)
  • 描述:Histogram 类型将会在一段时间范围内对数据进行采样(通常是请求持续时间或响应大小等等),并将其计入可配置的存储桶(bucket)中,后续可通过指定区间筛选样本,也可以统计样本总数。

Histogram 类型在应用场景中非常的常用,因为其代表的就是分组区间的统计,而在分布式场景盛行的现在,链路追踪系统是必不可少的,那么针对不同的链路的分析统计就非常的有必要,例如像是对 **RPC、SQL、HTTP、Redis 的 P90、P95、P99 **进行计算统计,并且更进一步的做告警,就能够及时的发现应用链路缓慢,进而发现和减少第三方系统的影响。

  • 常用方法
方法名作用
Observe(float64)将一个观察值添加到直方图。
  1. Summary(摘要)
  • 描述:Summary 类型将会在一段时间范围内对数据进行采样,但是与 Histogram 类型不同的是 Summary 类型将会存储分位数(在客户端进行计算),而不像 Histogram 类型,根据所设置的区间情况统计存储。提供三种摘要指标: 样本值的分位数分布情况,所有样本值的大小总和,样本总数

  • 常用方法

方法名作用
Observe(float64)将一个观察值添加到直方图。

使用PromQL 查询监控

PromQL是Prometheus自定义的一套强大的数据查询语言,除了使用监控指标作为查询关键字以为,还内置了大量的函数,帮助用户进一步对时序数据进行处理。 具体可以参考 教程

下面以监控CPU为例

对于节点我们首先能想到的就是要先对 CPU 进行监控,因为 CPU 是处理任务的核心,根据 CPU 的状态可以分析出当前系统的健康状态。要对节点进行 CPU 监控,需要用到 node_cpu_seconds_total 这个监控指标,在 metrics 接口中该指标内容如下所示:

 1
 2
 3
 4
 5
 6
 7
 8
 9
10
11
12
13
14
15
16
17
18
19
20
21
$ curl 127.0.0.1:9100/metrics -s |grep -v "#" |grep node_cpu
node_cpu_guest_seconds_total{cpu="0",mode="nice"} 0
node_cpu_guest_seconds_total{cpu="0",mode="user"} 0
node_cpu_guest_seconds_total{cpu="1",mode="nice"} 0
node_cpu_guest_seconds_total{cpu="1",mode="user"} 0
node_cpu_seconds_total{cpu="0",mode="idle"} 130304.6
node_cpu_seconds_total{cpu="0",mode="iowait"} 17.37
node_cpu_seconds_total{cpu="0",mode="irq"} 0
node_cpu_seconds_total{cpu="0",mode="nice"} 20.25
node_cpu_seconds_total{cpu="0",mode="softirq"} 12.51
node_cpu_seconds_total{cpu="0",mode="steal"} 0
node_cpu_seconds_total{cpu="0",mode="system"} 585.6
node_cpu_seconds_total{cpu="0",mode="user"} 467.62
node_cpu_seconds_total{cpu="1",mode="idle"} 130201.93
node_cpu_seconds_total{cpu="1",mode="iowait"} 78.33
node_cpu_seconds_total{cpu="1",mode="irq"} 0
node_cpu_seconds_total{cpu="1",mode="nice"} 18.39
node_cpu_seconds_total{cpu="1",mode="softirq"} 12.38
node_cpu_seconds_total{cpu="1",mode="steal"} 0
node_cpu_seconds_total{cpu="1",mode="system"} 590.54
node_cpu_seconds_total{cpu="1",mode="user"} 464.42

从接口中描述可以看出该指标是用来统计 CPU 每种模式下所花费的时间,是一个 Counter 类型的指标,也就是会一直增长,这个数值其实是 CPU 时间片的一个累积值,意思就是从操作系统启动起来 CPU 开始工作,就开始记录自己总共使用的时间,然后保存下来,而且这里的累积的 CPU 使用时间还会分成几个不同的模式。

接下来我们来对节点的 CPU 进行监控,我们也知道一个一直增长的 CPU 时间对我们意义不大,一般我们更希望监控的是节点的 CPU 使用率。

要计算 CPU 的使用率,那么就需要搞清楚这个使用率的含义,CPU 使用率是 CPU 除空闲(idle)状态之外的其他所有 CPU 状态的时间总和除以总的 CPU 时间得到的结果,理解了这个概念后就可以写出正确的 promql 查询语句了。

要计算除空闲状态之外的 CPU 时间总和,更好的方式是不是直接计算空闲状态的 CPU 时间使用率,然后用 1 减掉就是我们想要的结果了,所以首先我们先过滤 idle 模式的指标,在 Prometheus 的 WebUI 中输入 node_cpu_seconds_total{mode="idle"} 进行过滤:

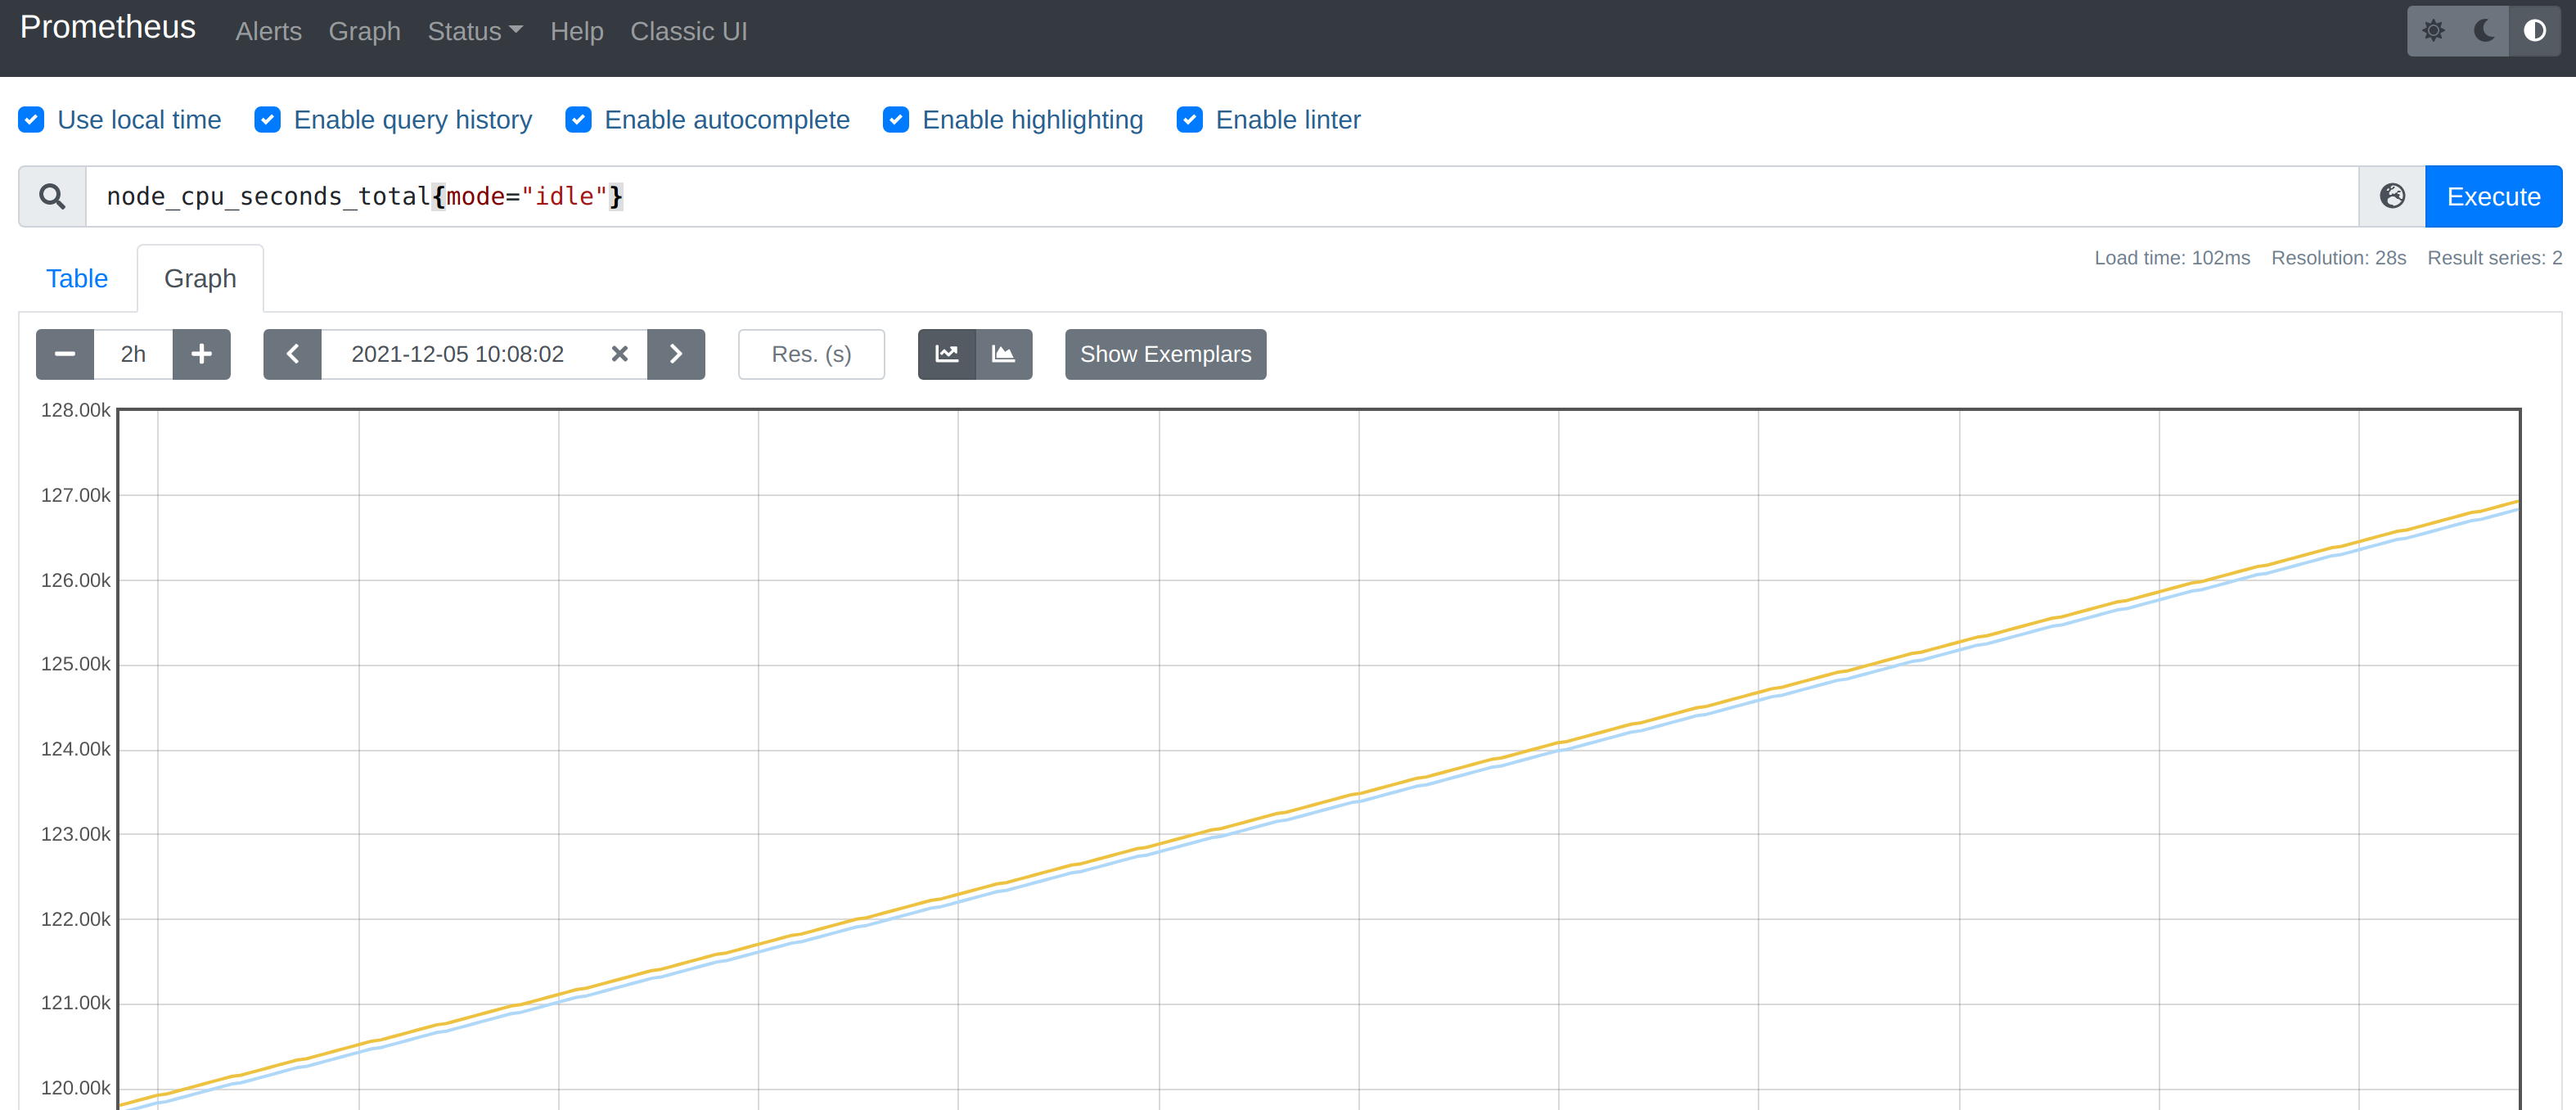
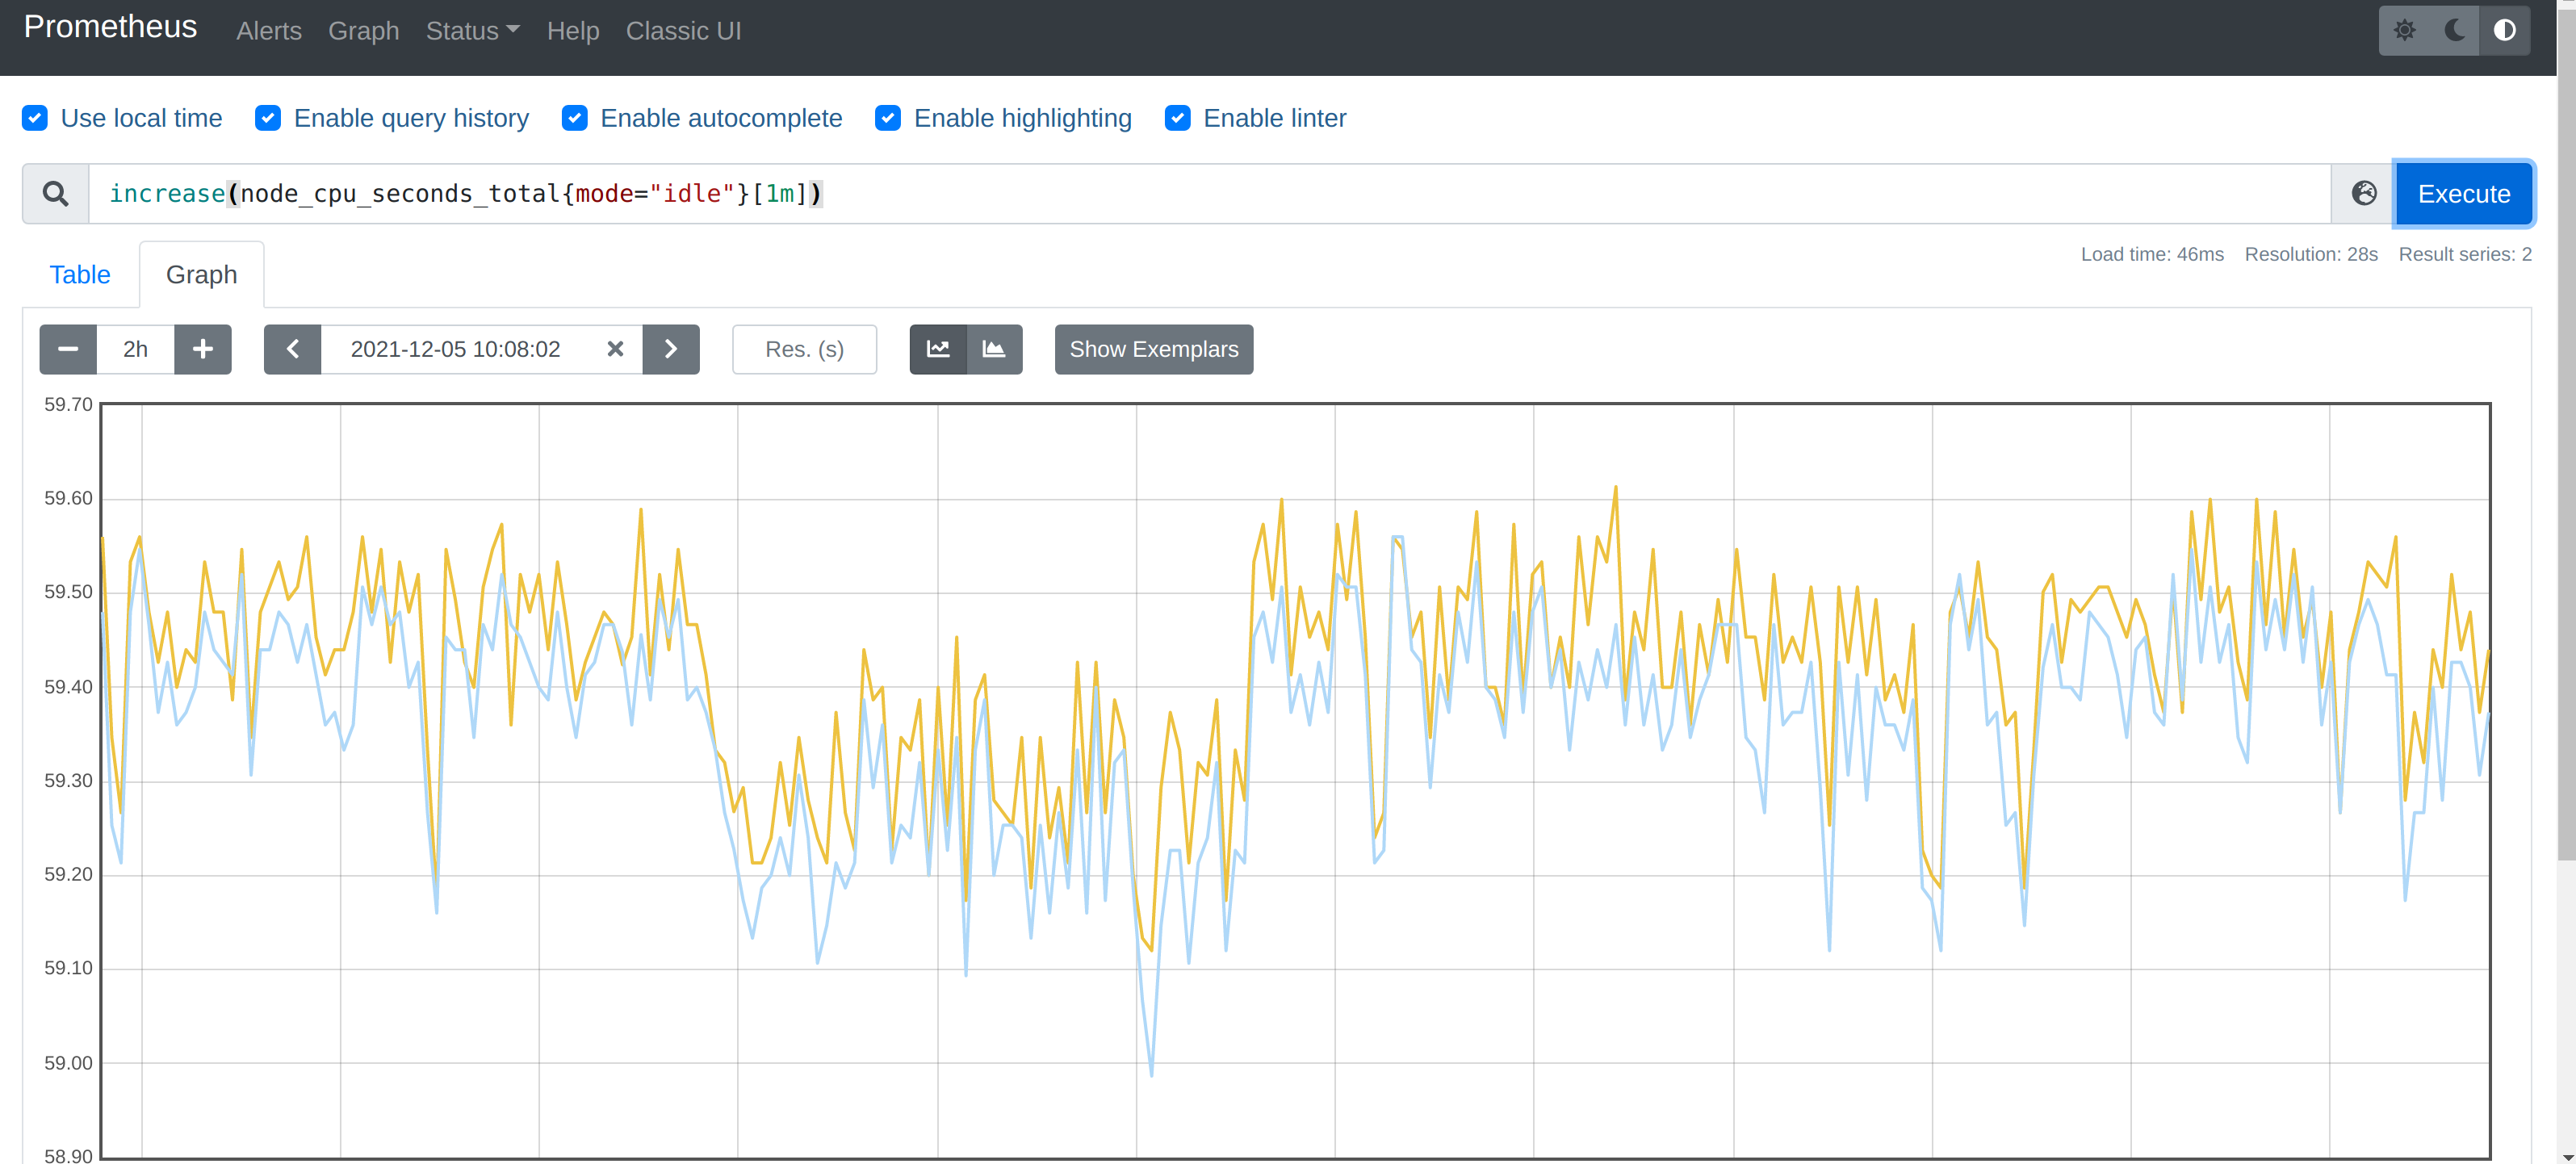
要计算使用率,肯定就需要知道 idle 模式的 CPU 用了多长时间,然后和总的进行对比,由于这是 Counter 指标,我们可以用 increase 函数来获取变化,使用查询语句 increase(node_cpu_seconds_total{mode="idle"}[1m]),因为 increase 函数要求输入一个区间向量,所以这里我们取 1 分钟内的数据:

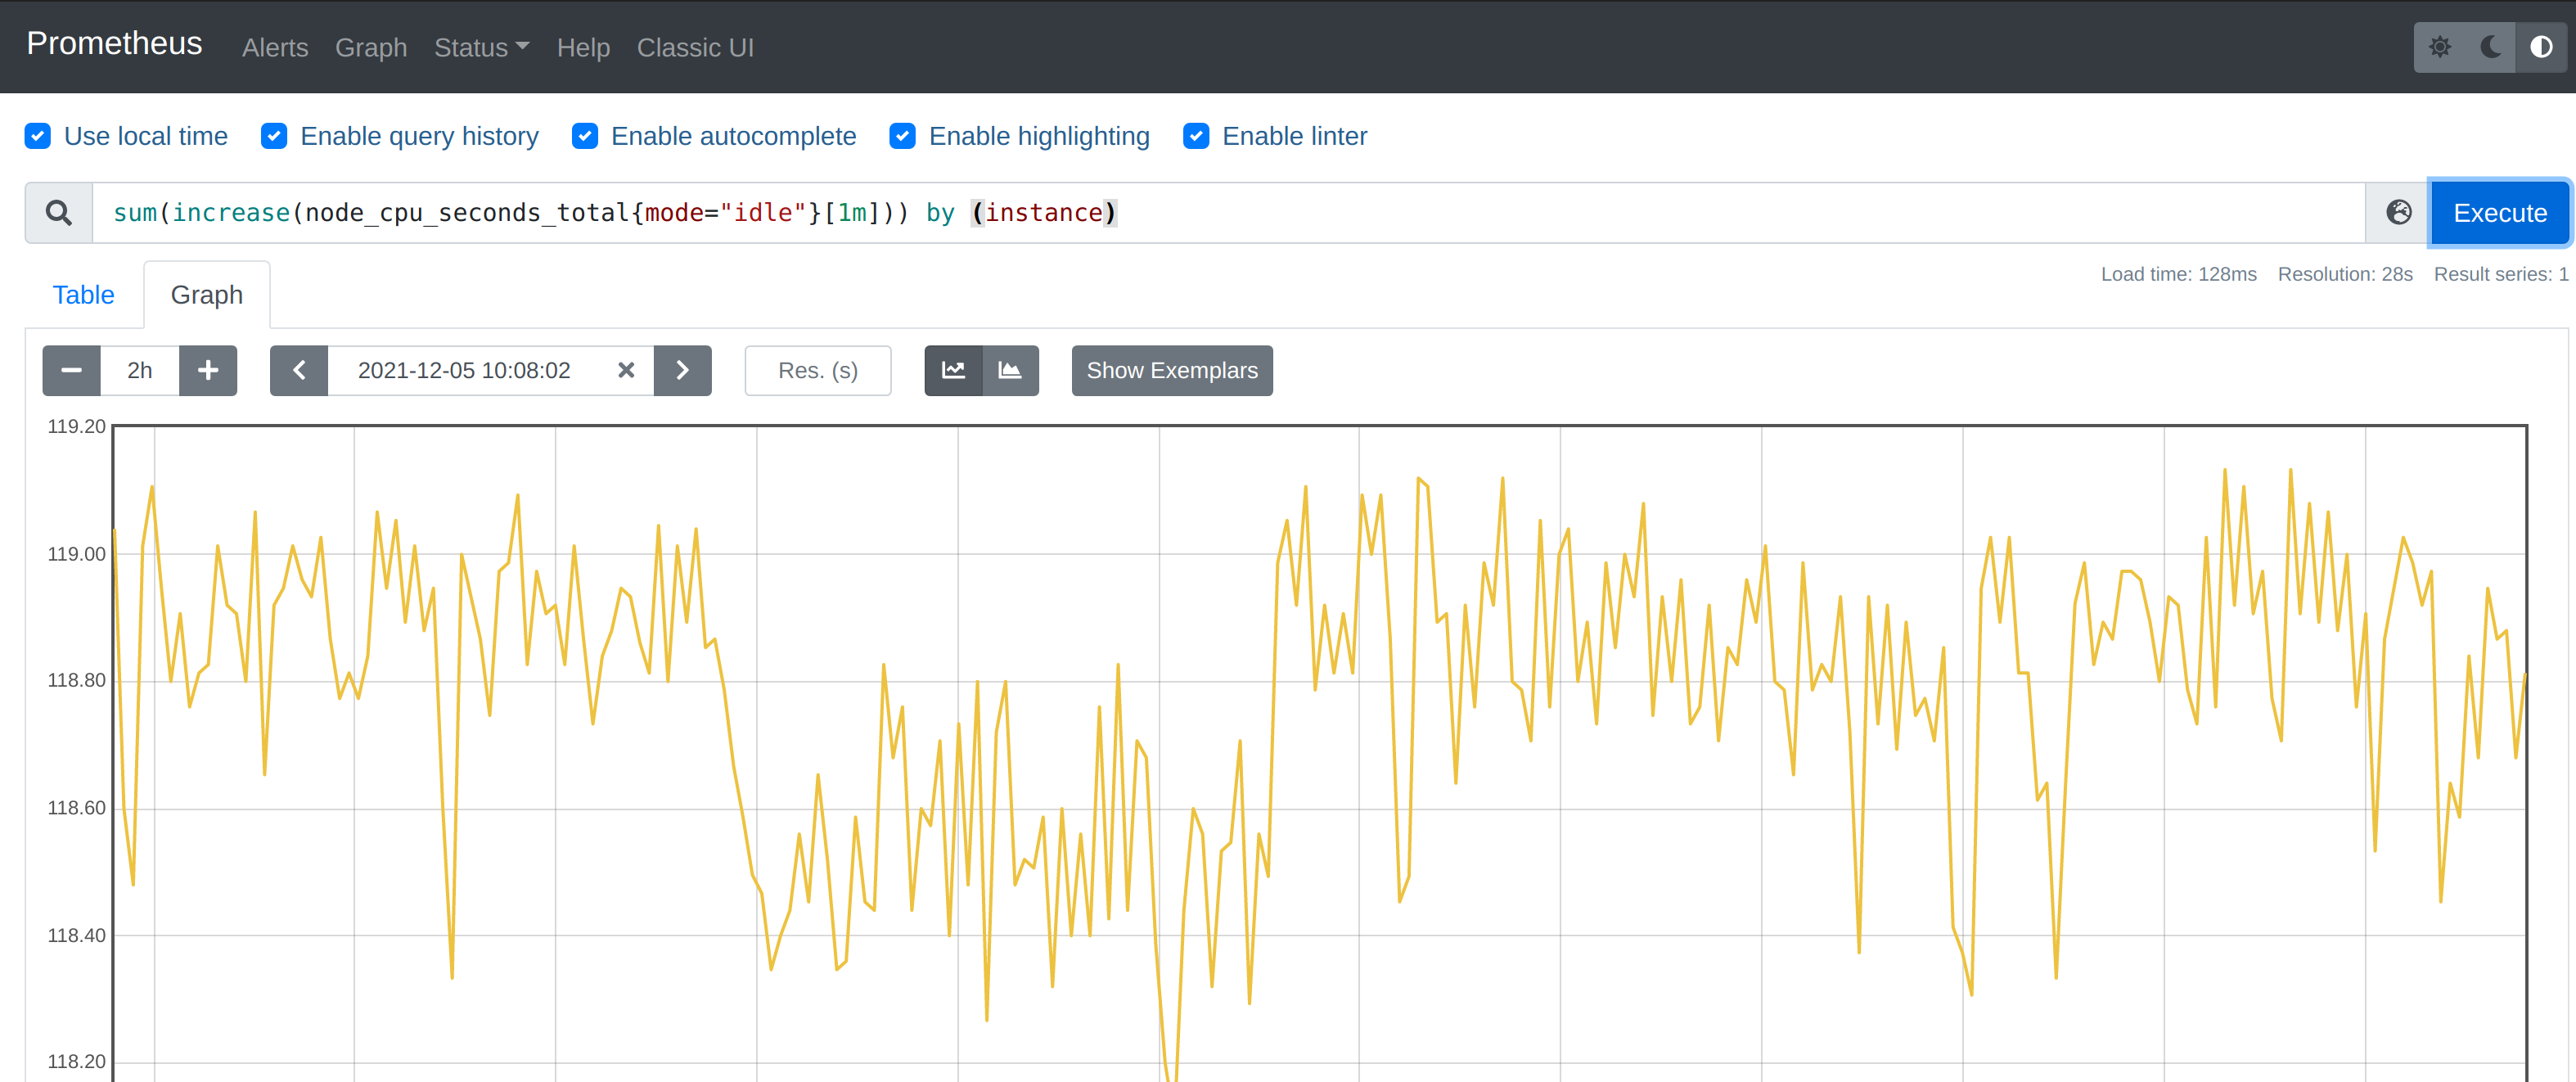
我们可以看到查询结果中有很多不同 cpu 序号的数据,我们当然需要计算所有 CPU 的时间,所以我们将它们聚合起来,我们要查询的是不同节点的 CPU 使用率,所以就需要根据 instance 标签进行聚合,使用查询语句 sum(increase(node_cpu_seconds_total{mode="idle"}[1m])) by (instance)

这样我们就分别拿到不同节点 1 分钟内的空闲 CPU 使用时间了,然后和总的 CPU (这个时候不需要过滤状态模式)时间进行比较即可,使用查询语句 sum(increase(node_cpu_seconds_total{mode="idle"}[1m])) by (instance) / sum(increase(node_cpu_seconds_total[1m])) by (instance)

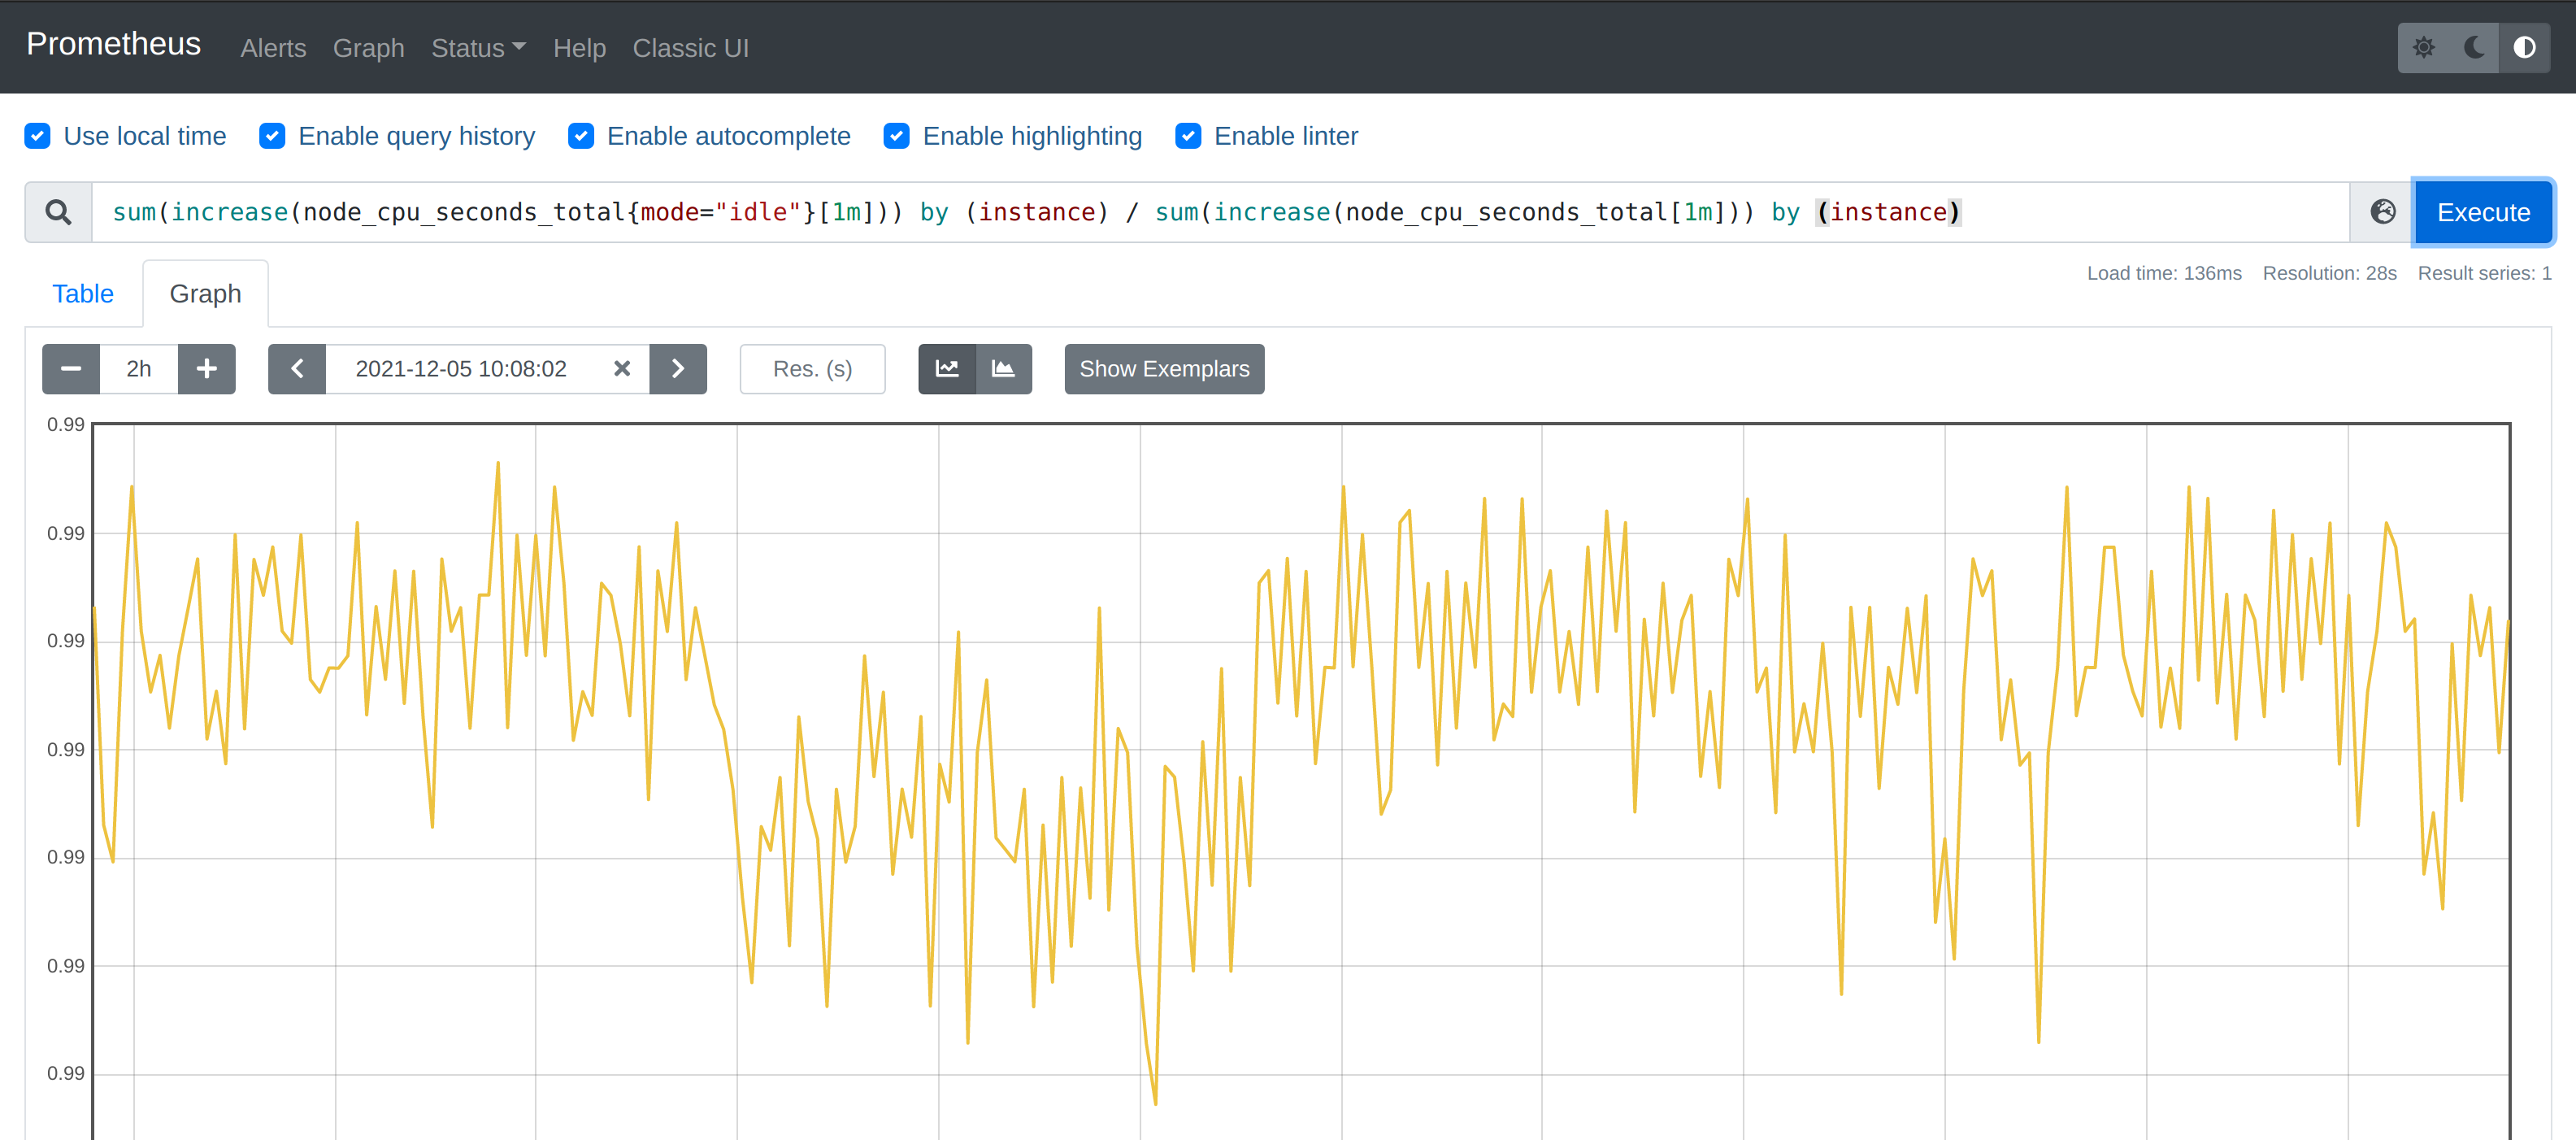
然后计算 CPU 使用率就非常简单了,使用 1 减去乘以 100 即可:(1 - sum(increase(node_cpu_seconds_total{mode="idle"}[1m])) by (instance) / sum(increase(node_cpu_seconds_total[1m])) by (instance) ) * 100。这就是能够想到的最直接的 CPU 使用率查询方式了,当然前面我们学习的 promql 语法中提到过更多的时候我们会去使用 rate 函数,而不是用 increase 函数进行计算,所以最终的 CPU 使用率的查询语句为:(1 - sum(increase(node_cpu_seconds_total{mode="idle"}[1m])) by (instance) / sum(increase(node_cpu_seconds_total[1m])) by (instance) ) * 100

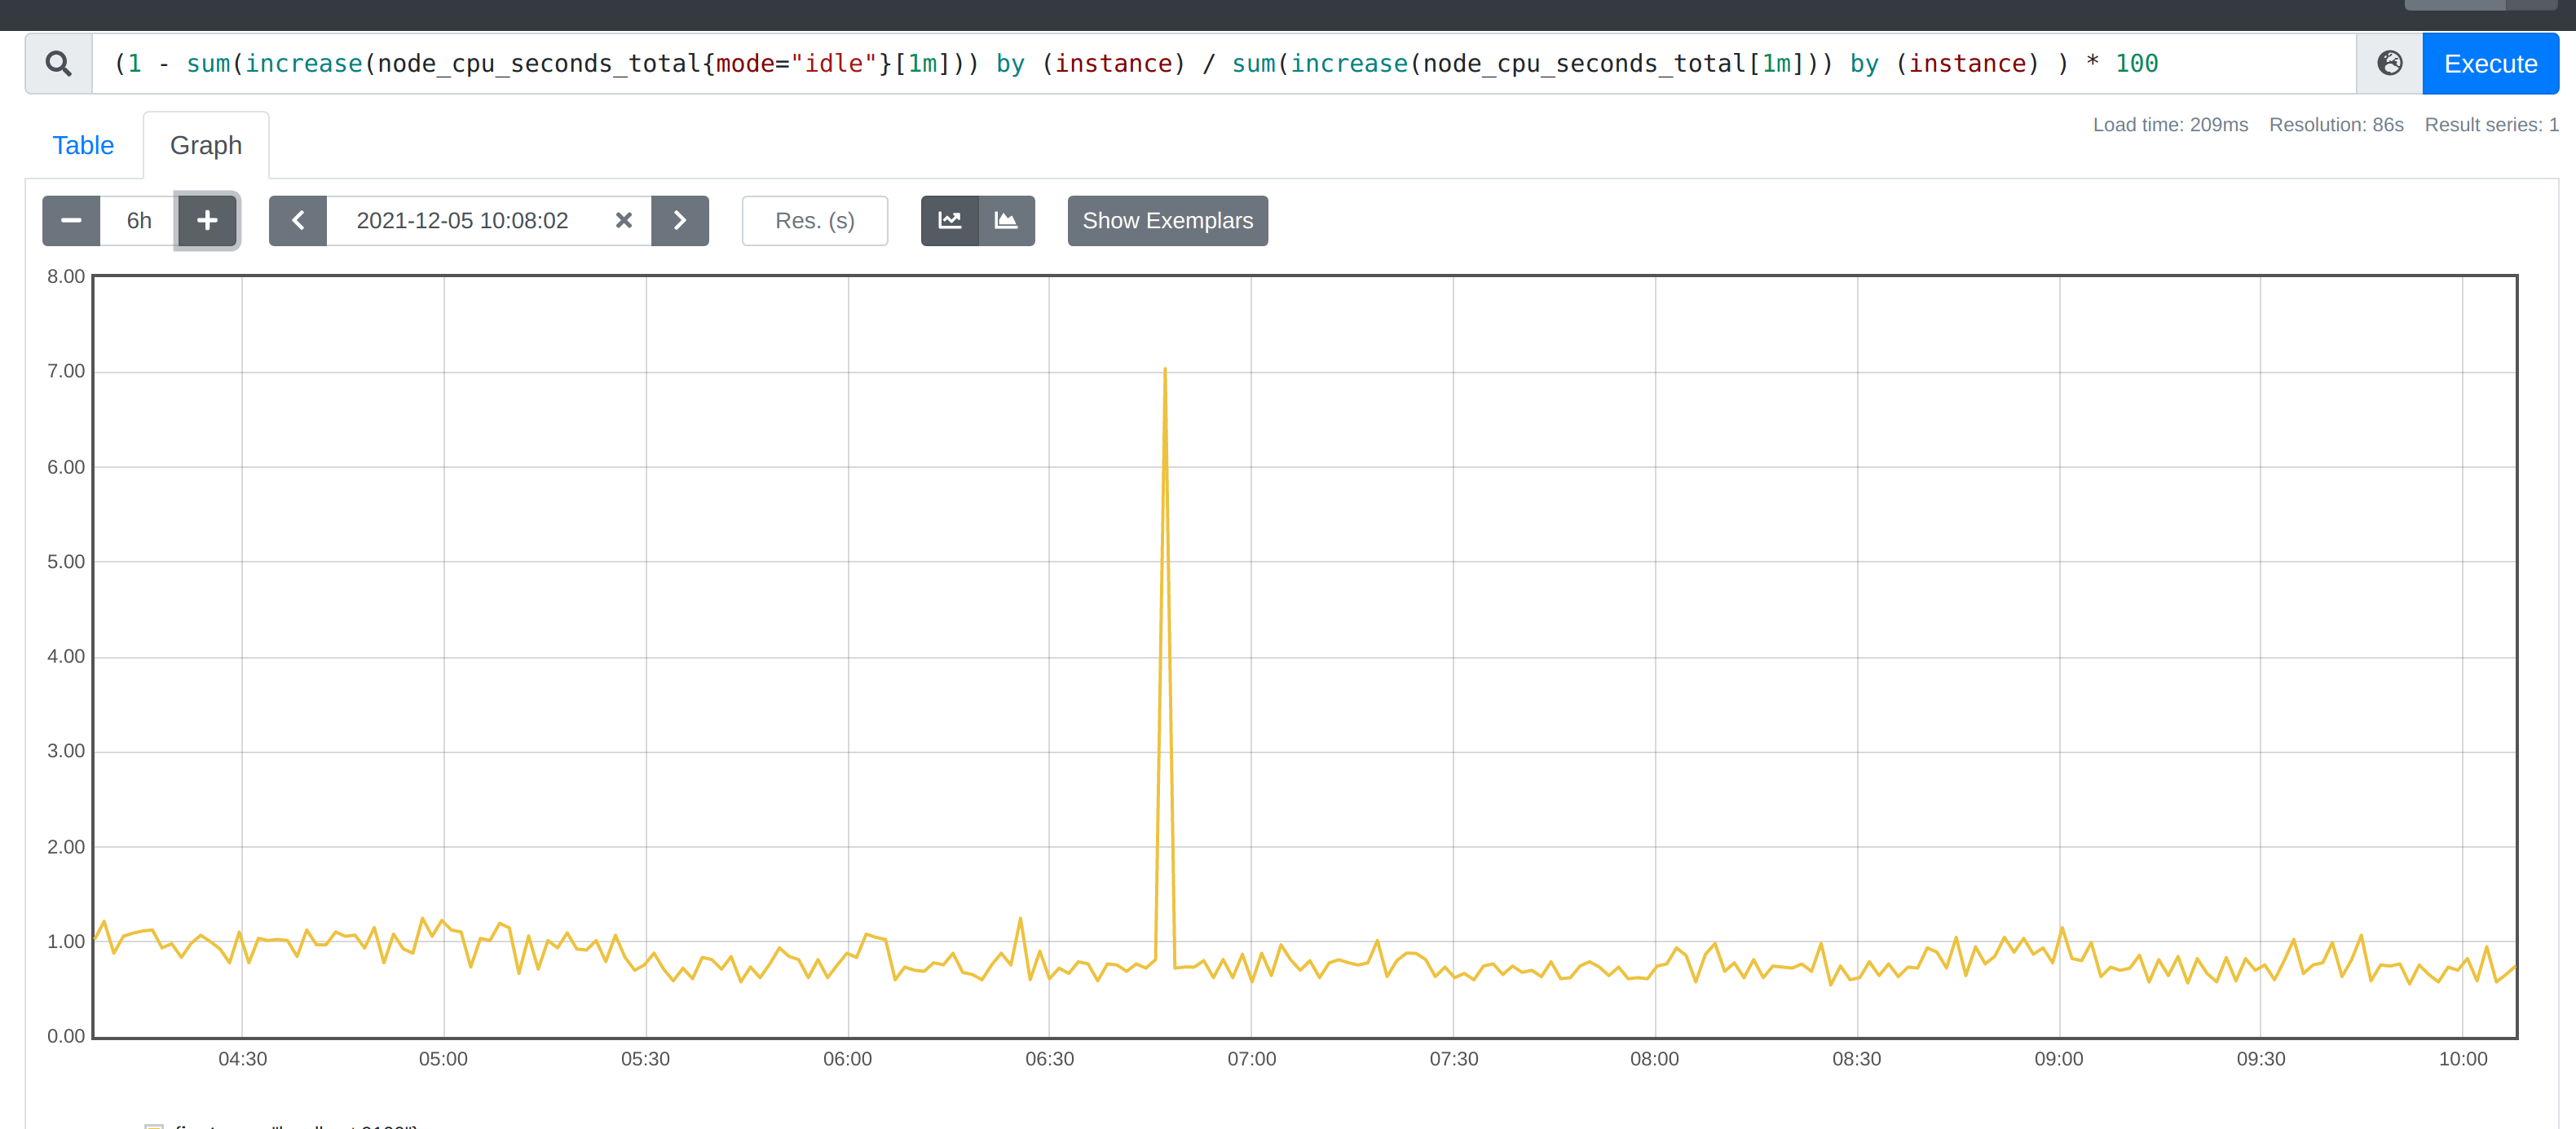
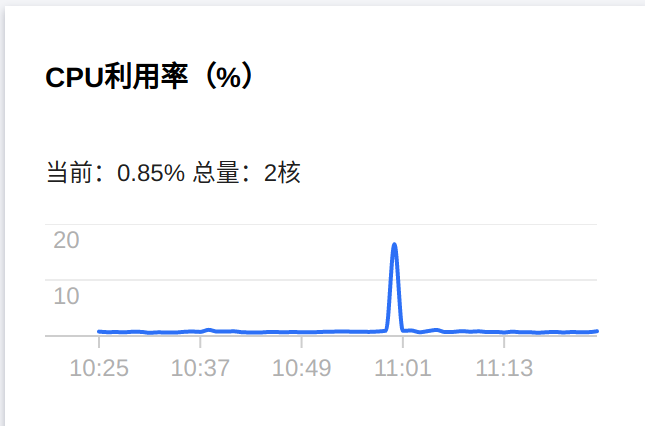
和腾讯云控制台的数据作对比, 指标趋势是一致的。

  • 使用Grafana创建可视化Dashboard

Prometheus UI提供了快速验证PromQL以及临时可视化支持的能力,而在大多数场景下引入监控系统通常还需要构建可以长期使用的监控数据可视化面板(Dashboard)。这时用户可以考虑使用第三方的可视化工具如Grafana,Grafana是一个开源的可视化平台,并且提供了对Prometheus的完整支持。 安装 grafana 参考文章

grafana 可以默认支持 prometheus 数据源的接入。访问http://localhost:3000就可以进入到Grafana的界面中,默认情况下使用账户admin/admin进行登录。在Grafana首页中显示默认的使用向导,包括:安装、添加数据源、创建Dashboard、邀请成员、以及安装应用和插件等主要流程。

按照上面的参考文章,可以完整的配置完成。

grafana 监控

首先在prometheus 上画好的图就可以在 grafana 上做监控了,我这里将 nginx-lua-prometheus 做了少许改造,可以参考: https://github.com/weijiaxiang007/nginx-lua-prometheus

一般的查询语法可以在 grafana 的官方网站上找一些。

https://grafana.com/grafana/dashboards/2949/revisions

nginx-lua-prometheus

nginx-lua-prometheus 是一个lua写的Nginx监控项目,可以拉取Nginx的相关metrics 生成监控dashboard。

参考github

1
git clone http://github.com/knyar/nginx-lua-prometheus

快速安装,需要将下面的内容写在 nginx.confhttp 块内。

 1
 2
 3
 4
 5
 6
 7
 8
 9
10
11
12
13
14
15
16
17
18
lua_shared_dict prometheus_metrics 10M;
lua_package_path "/path/to/nginx-lua-prometheus/?.lua;;";

init_worker_by_lua_block {
  prometheus = require("prometheus").init("prometheus_metrics")

  metric_requests = prometheus:counter(
    "nginx_http_requests_total", "Number of HTTP requests", {"host", "status"})
  metric_latency = prometheus:histogram(
    "nginx_http_request_duration_seconds", "HTTP request latency", {"host"})
  metric_connections = prometheus:gauge(
    "nginx_http_connections", "Number of HTTP connections", {"state"})
}

log_by_lua_block {
  metric_requests:inc(1, {ngx.var.server_name, ngx.var.status})
  metric_latency:observe(tonumber(ngx.var.request_time), {ngx.var.server_name})
}

在这个 prometheus 的统计代码中可以看到,在 init_worker_by_lua_block 有统计 HTTP 请求个数的 metric_requests, 和统计时延分布直方图的 metric_latency 和当前的链接数metric_connections

总的来说,prometheus 提供了 prometheus:counterprometheus:histogramprometheus:gauge 3个方法,分别用于counter(计数)、Gauge (仪表盘)、Histogram(累积直方图)

log_by_lua_block 中有两个函数进行累加和赋值操作。

接下来我们分析分析它的源码。

源码分析

先看看代码的总体结构, 一个可供外部调用的代码应该按照下面的格式。local Prometheus = {} 最后再 return Prometheus。这里的 mt = { __index = Prometheus } 会在后面的 init() 实现类的构造函数。

 1
 2
 3
 4
 5
 6
 7
 8
 9
10
11
12
13
14
15
16
17
18
19
local resty_counter_lib = require("prometheus_resty_counter")
local key_index_lib = require("prometheus_keys")

local Prometheus = {}
local mt = { __index = Prometheus }

local TYPE_COUNTER    = 0x1
local TYPE_GAUGE      = 0x2
local TYPE_HISTOGRAM  = 0x4
local TYPE_LITERAL = {
  [TYPE_COUNTER]   = "counter",
  [TYPE_GAUGE]     = "gauge",
  [TYPE_HISTOGRAM] = "histogram",
}

...


return Prometheus

再来分析其中的init 方法。这里的 local self = setmetable({}, mt) 将self指向自己本身。第19行 开始设置参数, 这里可以设置的参数有错误metrics 名字和同步间隔。可以 prometheus = require("prometheus").init("prometheus_metrics",{sync_interval=0.4}) 这样的方式调用。

 1
 2
 3
 4
 5
 6
 7
 8
 9
10
11
12
13
14
15
16
17
18
19
20
21
22
23
24
25
26
27
28
29
30
31
32
33
34
35
36
37
38
39
40
41
42
43
44
45
46
47
48
function Prometheus.init(dict_name, options_or_prefix)
  -- 检查当前正在运行的阶段名称
  if ngx.get_phase() ~= 'init' and ngx.get_phase() ~= 'init_worker' then
    error('Prometheus.init can only be called from ' ..
      'init_by_lua_block or init_worker_by_lua_block', 2)
  end

  -- 类的构造函数、并且判断是否在Nginx配置文件中设置共享内存。
  local self = setmetatable({}, mt)
  dict_name = dict_name or "prometheus_metrics"
  self.dict_name = dict_name
  self.dict = ngx.shared[dict_name]
  if self.dict == nil then
    error("Dictionary '" .. dict_name .. "' does not seem to exist. " ..
      "Please define the dictionary using `lua_shared_dict`.", 2)
  end

  -- 设置参数
  if type(options_or_prefix) == "table" then
    self.prefix = options_or_prefix.prefix or ''
    self.error_metric_name = options_or_prefix.error_metric_name or
      DEFAULT_ERROR_METRIC_NAME
    self.sync_interval = options_or_prefix.sync_interval or
      DEFAULT_SYNC_INTERVAL
  else
    self.prefix = options_or_prefix or ''
    self.error_metric_name = DEFAULT_ERROR_METRIC_NAME
    self.sync_interval = DEFAULT_SYNC_INTERVAL
  end

  self.registry = {}
  self.key_index = key_index_lib.new(self.dict, KEY_INDEX_PREFIX)

  self.initialized = true

  -- 注册请求错误个数的 counter
  self:counter(self.error_metric_name, "Number of nginx-lua-prometheus errors")
  self.dict:set(self.error_metric_name, 0)
  local err = self.key_index:add(self.error_metric_name)
  if err then
    self:log_error(err)
  end

  if ngx.get_phase() == 'init_worker' then
    self:init_worker(self.sync_interval)
  end
  return self
end

接下来只介绍一下 counter() 函数的执行逻辑,其本质是一个工厂函数,实际调用的是 register() 方法。

 1
 2
 3
 4
 5
 6
 7
 8
 9
10
11
12
13
14
15
16
17
18
19
20
21
22
23
24
25
26
27
28
29
30
31
32
33
34
35
36
37
38
39
40
41
42
43
44
45
46
47
48
49
50
51
52
53
54
55
56
57
58
59
60
61
62
63
64
65
66
67
68
69
70
71
72
73
74
75
76
77
-- Public function to register a counter.
function Prometheus:counter(name, help, label_names)
  return register(self, name, help, label_names, nil, TYPE_COUNTER)
end


-- register 工厂函数
local function register(self, name, help, label_names, buckets, typ)
  if not self.initialized then
    ngx.log(ngx.ERR, "Prometheus module has not been initialized")
    return
  end

  local err = check_metric_and_label_names(name, label_names)
  if err then
    self:log_error(err)
    return
  end

  local name_maybe_historgram = name:gsub("_bucket$", "")
                                    :gsub("_count$", "")
                                    :gsub("_sum$", "")
  -- 判断是否有重复的metric                                  
  if (typ ~= TYPE_HISTOGRAM and (
      self.registry[name] or self.registry[name_maybe_historgram]
    )) or
    (typ == TYPE_HISTOGRAM and (
      self.registry[name] or
      self.registry[name .. "_count"] or
      self.registry[name .. "_sum"] or self.registry[name .. "_bucket"]
    )) then

    self:log_error("Duplicate metric " .. name)
    return
  end

  -- 初始化 metrics
  local metric = {
    name = name,
    help = help,
    typ = typ,
    label_names = label_names,
    label_count = label_names and #label_names or 0,
    -- Lookup is a tree of lua tables that contain label values, with leaf
    -- tables containing full metric names. For example, given a metric
    -- `http_count` and labels `host` and `status`, it might contain the
    -- following values:
    -- ['me.com']['200'][LEAF_KEY] = 'http_count{host="me.com",status="200"}'
    lookup = {},
    parent = self,
    -- Store a reference for logging functions for faster lookup.
    _log_error = function(...) self:log_error(...) end,
    _log_error_kv = function(...) self:log_error_kv(...) end,
    _key_index = self.key_index,
    _dict = self.dict,
    reset = reset,
  }
  
  -- 将封装方法赋值给 metric 
  if typ < TYPE_HISTOGRAM then
    if typ == TYPE_GAUGE then
      metric.set = set
      metric.inc = inc_gauge
    else
      metric.inc = inc_counter
    end
    metric.del = del
  else
    metric.observe = observe
    metric.buckets = buckets or DEFAULT_BUCKETS
    metric.bucket_count = #metric.buckets
    metric.bucket_format = construct_bucket_format(metric.buckets)
  end

  self.registry[name] = metric
  return metric
end